
 June 19, 2014
The Prime Therapeutics Drug Trend Report was released yesterday. Interestingly, they start out the report by making the point that what really should matter is net ingredient cost not trend. I’ve made the point before that trend isn’t a great number to focus on for many reasons. And, if you’re comparing trend numbers (which we all do), then you need to understand different methodologies. I think Adam Fein does a good job of summarizing that in his post. (BTW – This is a tough discussion to have especially when you’re getting spreadsheeted by consultants as part of an RFP.)
As comparisons, you can see my reviews of the other drug trend reports here:
Their report was short and to the point. Here’s some of the key data points:
- 25M members
- 80.6% generic fill rate
- 12.7 Rxs PMPY
- Overall drug trend = 3.3%
- Specialty drug trend = 19.5%
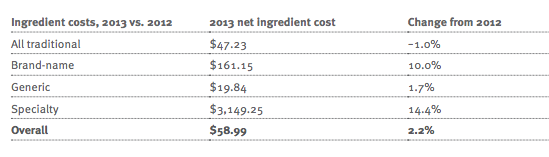
- Net ingredient cost trend = 2.2%

- The net ingredient cost per Rx = $58.99 (this is net of rebates and takes into account acquisition costs and network discounts)
- They state that this beats the competition by $6.00 per Rx
Of course, anything anyone really cares about these days is specialty. Specialty represents only 0.4% of the scripts they fill but 20.5% of the spend for a commercial account. (They point out that this is much less as a percentage of scripts than other PBMs which have closer to 1% of their scripts classified as specialty…which could influence trend numbers.) The chart below shows how some of the things we all did around traditional drugs apply to specialty drugs.

And, they make a few predictions going forward:


No comments yet... Be the first to leave a reply!