Tag Archives: DTR

Prime Therapeutics Drug Trend Report 2014 Report

The Prime Therapeutics Drug Trend Report was released yesterday.  Interestingly, they start out the report by making the point that what really should matter is net ingredient cost not trend.  I’ve made the point before that trend isn’t a great number to focus on for many reasons.  And, if you’re comparing trend numbers (which we all do), then you need to understand different methodologies.  I think Adam Fein does a good job of summarizing that in his post.  (BTW – This is a tough discussion to have especially when you’re getting spreadsheeted by consultants as part of an RFP.)

As comparisons, you can see my reviews of the other drug trend reports here:

Their report was short and to the point.  Here’s some of the key data points:

  • 25M members
  • 80.6% generic fill rate
  • 12.7 Rxs PMPY
  • Overall drug trend = 3.3%
  • Specialty drug trend = 19.5%
  • Net ingredient cost trend = 2.2%

Prime Trend Drivers DTR 2013


  • The net ingredient cost per Rx = $58.99 (this is net of rebates and takes into account acquisition costs and network discounts)
    • They state that this beats the competition by $6.00 per Rx

Prime Net Ing Cost DTR 2013


Of course, anything anyone really cares about these days is specialty.  Specialty represents only 0.4% of the scripts they fill but 20.5% of the spend for a commercial account.  (They point out that this is much less as a percentage of scripts than other PBMs which have closer to 1% of their scripts classified as specialty…which could influence trend numbers.)  The chart below shows how some of the things we all did around traditional drugs apply to specialty drugs.

Prime Trad vs Specialty Rx DTR 2013


And, they make a few predictions going forward:

Prime Forecast DTR 2013


CVS Caremark 2013 Drug Trend Report (Insights 2014)

The CVS Caremark publication Insights 2014: Advancing The Science Of Pharmacy Care came out the other day. They took a different approach than the detailed trend report which Express Scripts put out.  Their document is more of a white paper about “7 Sure Things”.

The 7 Sure Things are to help you know what to do with your pharmacy benefit and cover:

  1. Prescription trend is on the rise.
  2. Generics have peaked…and you’re going to feel the difference.
  3. Specialty drives trend.  But do you know how much?
  4. Price is King…Not much of a surprise there.
  5. Money matters to members.  Cost share does influence behavior.
  6. Adherence is the answer.  No one said it was going to be easy.
  7. Past performance is no guarantee of future results.

If you’re managing a pharmacy program and you’re surprised by any of these, I would suggest you look for another job.

So, let’s drill down into the report to see what it shows us:

  • Their trend numbers were:

o   0.8% for traditional (non-specialty) drugs

o   15.6% for specialty drugs (down from 18.3% in 2012)

o   3.8% overall

  • While utilization was up 2.1%, the primary driver was price which increased 8.2%.  These factors were mitigated by a 6.0% change in mix.

o   They hint at an interesting question of whether utilization is growing due to an improving economy.  (correlation or causality?)

CVS Caremark Drug Trend 2013

  • Their GDR (generic dispensing rate) was 81.4% in 2013.  (I’d love their perspective on a maximum GDR since they say it’s peaked.)
  • I like the chart below which shows trend with and without generics coming to market.

CVS Caremark DTR 2013 -trend wo generics.jpg

  • Of course, specialty continues to be the real story in all the PBM reports.

CVS Caremark DTR 2013 -specialty.jpg

  • They claim that 53% of total specialty medication costs were paid under the medical benefit in 2012 which is in-line with most projections.  (While they give some perspective on what to do here, this would be one thing I would have liked to see broken out in more detail as this is a critical area for PBMs which hasn’t been cracked yet.)
  • They share the AWP trend broken out below and give some crazy examples of AWP price inflation (e.g., 573% for clomipramine) with some explanation for why this happens.

CVS Caremark DTR 2013 -awp trend.jpg

  • Here were their top 10 specialty drug categories.  The top 5 are the same as the CatamaranRx list, but the bottom 5 are in a different order.

CVS Caremark DTR 2013 -top 10 specialty.jpg

  • A scary statistic (in isolation) is that over the past 5 years patient out-of-pocket costs for prescriptions have climbed 250%.  (But, I think their percentage of cost share has stayed the same.  It would be interesting to show this in real dollars and compare this to both price and wage inflation just to hammer home the point.)
  • They talk about CDHPs (consumer driven health plans) and how that is impacting utilization and cost.  (These are often high deductible plans where consumers pay out of pocket until they reach a certain amount…which often really makes the point in early January to consumers.  And, can lead to dissatisfaction when that prescription that was $30 in December is now $350 in January.)
  • They talk about adherence, and they certainly have continued to publish a lot of studies in this space.  (They also know have Dr. Will Shrank on their staff full-time after working with him for years.  I think very highly of Will as one of the best adherence researchers in the country.)
  • They give a real high level mention of some of their new efforts around adherence:

o   Simpler labels

o   Synchronizing refill dates

o   Reminder devices

o   Digital / mobile tools

  • They also provide this nice summary of how costs go up and where the savings come from.  (Of course, the challenge is in drug classes other than these three and getting clients to give you any credit for the productivity savings and also netting out the program costs.)

CVS Caremark DTR 2013 - adherence value.jpg

  • On a scary note, they predict that Rx trends may jump back into the double digits for the next 4 years.

At the end, they give 5 sure strategies that clients should do.

  1. Double down on generics.  (To me, this means – step therapies, formularies, setting copays right, mandatory generic programs, and generic substitution programs.)
  2. Look across benefits at specialty.  (This is a key one as I mentioned above.  You need to think through how specialty drugs are filled and billed under medical.)
  3. Tackle price.  (They are focused on distribution channel here, but I’d also think about copay levels, plan design, and value-based programs.)
  4. Be strategic about cost share.  (They are focused on how cost share affects adherence which is important, but only one component of an adherence strategy.)
  5. Keep the big picture in mind.  (They allude to it here, but I think this is a key point that ultimately it’s about outcomes and prevention.)

Overall, this was certainly the easiest “trend report” to read. It tells a clear story which is probably great for the average client and would drive more discussion with your account manager.

2013 CatamaranRx Drug Trend Report

I just finished reading the 2013 CatamaranRx Drug Trend Report (2014 Informed Trends: Moments of Opportunity) and wanted to share some of the things that caught my eye. (BTW – CatamaranRx was formed by the merger of SXC and CatalystRx.)

One of the early comments in the document caught my eye. While simple, it is still so true in healthcare.

“Bringing consistency through a national perspective on best practices, a “local” understanding of how health care is practiced and deep insights at the individual level, to promote the very best outcomes.”

CatamaranRx Trend

  • They did a good job of tackling the impact of healthcare reform on the PBM marketplace and why this creates more opportunities.

“The looming pharmacy demand is also driving the healthcare market toward expanded cost containment and coordinated care measures. Industry estimates are projecting more than 30 million new PBM customers as a result of the ACA. This influx of new customers will stimulate creative cost management paradigms and entice new entrants into the PBM sector.”

  • 50% of the new drugs approved by the FDA in 2013 were specialty drugs.  (reiterating the fact that specialty is really the focus of the PBM today in terms of opportunity to influence trend)
  • 30% of the new drugs approved were oncology drugs.  (similar to years past)
  • Orphan drugs without competition were 2.6x more expensive than orphan drugs with competition.  (not too surprising)
  • They point out that no true biosimilar has been approved in the US (which I didn’t realize).  They also point out that international experience is that biosimilars will save 10-15% not the 40% projected by the CBO.
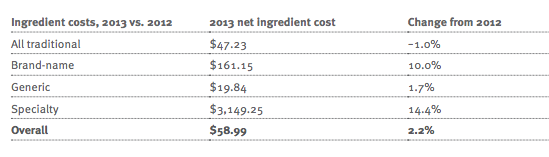
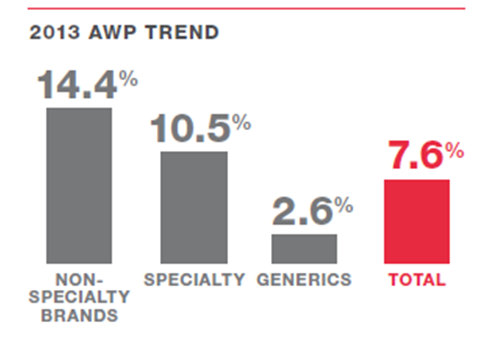
  • They have nice clean charts around price inflation (deflation) for brand and generic drugs.

2013 CatamaranRx Brand Rxs

2013 CatamaranRx Generic Rxs

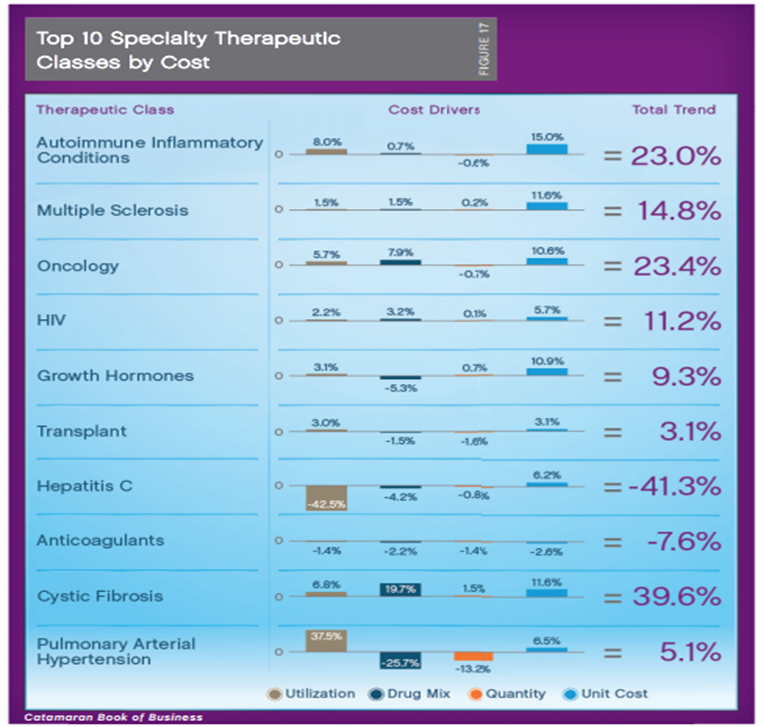
  • The average cost of a specialty drug rose to $2,860 in their book-of-business.
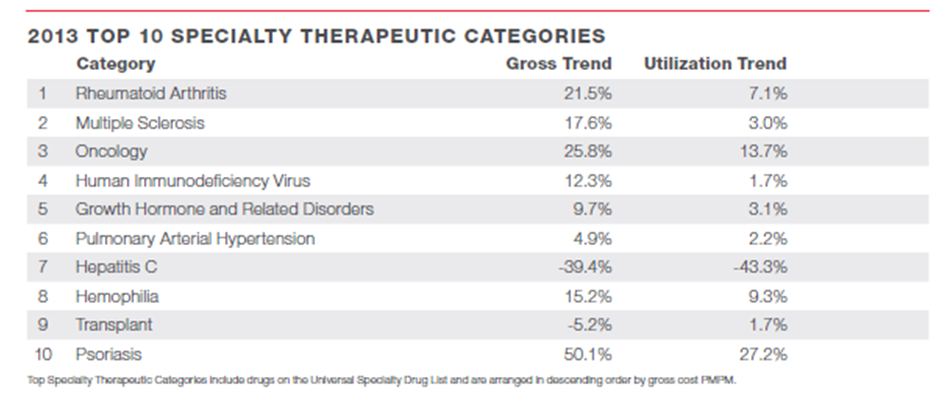
  • The top 10 specialty drug classes represent 86% of specialty drug spend.

2013 CatamaranRx Top Specialty Classes

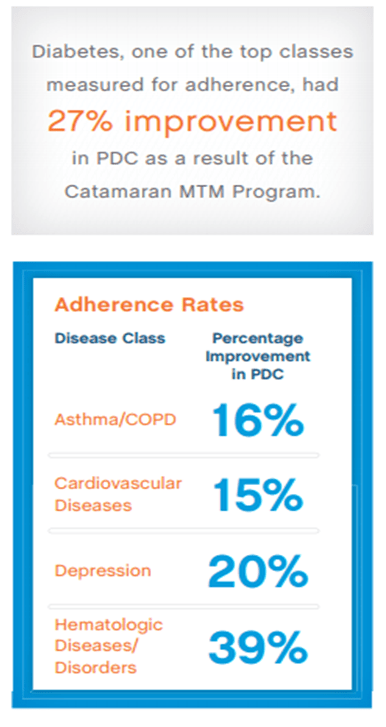
  • The report talks about medication adherence using PDC (proportion of days covered).  They show some good adherence rates in key classes (which always brings up questions about methodology).

o   Over what time period?

o   Is this all members prescribed an Rx?

o   Is this all members with one Rx?

o   What is the percentage of members with over 80% PDC (versus the average PDC)?

o   (Note: These are the same questions for every PBM that shows you adherence numbers.)

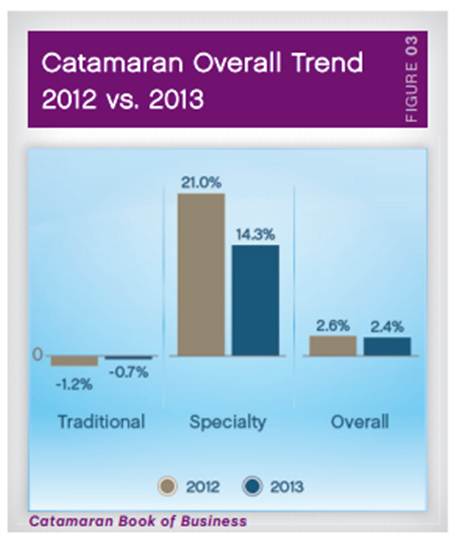
  • Here’s their forecast for the next few years in terms of trend.

2013 CatamaranRx Trend Forecast

  • They are projecting a generic fill rate of as high as 90% by the end of 2016!
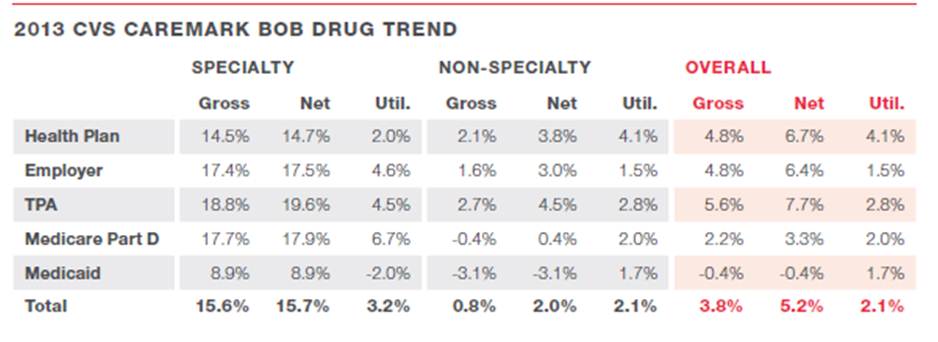
  • I like that they break out their highly managed clients to show they got an overall trend of -0.1% even though they had higher specialty trend driven by oncology.  They shared a list of key things that those clients were doing:

o   Member risk scoring and personalized interventions.

o   Tailored clinical programs, including step therapy, quantity limits and prior authorization.

o   Aggressive management of controlled drugs to reduce misuse and abuse.

o   Formulary management tailored to address client-specific, high-cost medication classes.

o   Exclusive specialty through BriovaRx, a high-touch, patient-centric model.

o   Plan designs with copay differentials that promote cost-effective choices.

o   Multi-channel communications that engage members in their healthcare.

  • I was excited to see them dedicate a whole section talking about engagement.

o   The need for the right message.

o   The need for targeting algorithms.

o   The need to vary channel based on preference.

  • They share some details on their hospital discharge program which sounds right from a PBM perspective – focused on medication reconciliation and adherence.  My key question would be understanding if they address the other risks of re-admission while they have the patient on the phone (i.e., treating the patient not the Rx and not the disease).
  • I haven’t heard as much about MTM lately so it was nice to see them talk about it and see some results which seem really good.

2013 CatamaranRx MTM

Two miscellaneous comments here:

  1. This seems to be a much improved document than the one I reviewed years ago from SXC.
  2. My only challenge with the format was that it prints the two pages on one page in the PDF (but that could be user error).

Express Scripts 2013 Drug Trend Report

I always enjoy reviewing the PBM Drug Trend Reports.  Even though these past two years I’ve been focused more on the care management side of healthcare, I continue to see these two paths colliding in interesting ways in the near future. 

Here’s my big takeaways from the report some of which you can get in their Executive Summary

(I’d also encourage you to look at Adam Fein’s review…where he unfortunately beat me to the punch again.)

  • Overall trend was 5.4% which they did a nice job of breaking out according to different lines of business.
    ImageImageImage
  • They also showed the breakout of trend comparing specialty drug trend versus traditional oral solid medications. 

 Image

  • Specialty trend was up 14.1% based on a 2.5% increase in utilization and an 11.6% increase in unit cost.
  • A key point is that specialty now makes up 27.7% of the total drug spend for a payer (and that doesn’t even count the ~50% of specialty drugs billed under the medical benefit).
  • Diabetes was the standout category within traditional drug classes with increased utilization and price increases.  [Which isn’t surprising to those of us working on the clinical side that see huge innovation and investment in the diabetes area – Omada Health, Telcare, and Welldoc (for example).]
    Image
  • While they make a key point with data that member cost share is going down and actual out-of-pocket costs are only going up marginally, I think it ignores the reality that consumers are feeling the pain of out-of-pocket spending more especially with all the High Deductible plans out there.
    Image
  • They do reinforce their previous messaging around waste and also introduce their Health Decision ScienceTM approach.  (I personally would have liked to see more on this.  How is the blending of Consumerology and the Therapeutic Resource Centers impacting utilization, adherence, waste, clinical outcomes, patient satisfaction, or other key metrics?)
  • As always, you can dig into their forecasts by drug class.  I choose cancer as one area to look at.  (While this is focused on the basics, I would have loved more about what’s going on around cancer.  How are genetic tests impacting use?  What about survivorship?  How do Centers of Excellence affect outcomes, drug selection, pricing, and adherence?)
  • On top of being able to drill down on Medicare and Medicaid, you can also look at a Worker’s Compensation specific version of the drug trends.  This is interesting since that business is different than the traditional PBM market and is an area that Express Scripts has gone aggressively after in recent years. 
  • One thing I couldn’t find in the document (which is hard to read in the current format) is the average number of Rxs PMPM or PMPY which is just a good stat that I personally track. 
  • One note I will offer on methodology is the definition of specialty drugs.  This could lead to some differences between PBMs as we try to compare their trend numbers.  Here’s the definition Express Scripts offers:

“Specialty medications include injectable and noninjectable drugs that are typically used to treat chronic, complex conditions and may have one or more of the following qualities: frequent dosing adjustments or intensive clinical monitoring; intensive patient training and compliance assistance; limited distribution; and specialized handling or administration. – See more at: http://lab.express-scripts.com/drug-trend-report/appendix/methodology#sthash.dhJhFIZs.dpuf”