Tag Archives: benefits

New/Old Accusations About PBMs And Their Margins

PBMs (or Pharmacy Benefit Managers) are big business.  Just look at a few of the names and their place on the Fortune 500 list:

Not surprisingly, none of those are non-profits.  There is real money being made here.  It’s all part of the mark-up game in healthcare.  The question of course is does the money being made justify the profits.  For example, I’m happy to pay my banker lots of money as long as he’s earning me more than he’s making (and significantly more).

This is a complicated question.  (see past posts on What’s Next, Why People Don’t Save With Mail, and Growing Mail Order)  I’ve also presented on this topic several times in the past pointing out that the model needs to change, and re-iterating the fact that PBMs made a mistake by putting all their profits in the generic space.  I’ve always said that disintermediation would happen by focusing on generics at mail which is where all the money was at Express Script (8 years ago).  [People remind me that some of this has changed and is different across PBMs.]

The new Fortune article by Katherine Eban called “Painful Prescription” certains shows a dark story.  It focuses exactly on one of these scenarios which is the gap between acquisition cost and client cost.  The article talks about paying $26.91 for a drug but selling it to the client at $92.53.  I’m always reminded of the fact that at one time we used to buy fluoxetine (generic Prozac) for about $0.015 per pill.  On the flipside, we had brand drugs that we bought for more than we got reimbursed and lost money.  It was strange model.

So, here’s my questions:

  1. Do you want transparency?  If so, there are lots of “transparent PBMs” and many larger PBMs will do transparent deals.  You can also follow the Caterpillar model.  (Don’t forget that pharmacy represents less than 20% of your total healthcare spend so you can find yourself down the rabbit hole here trying to shave 2% of spend on 20% or 0.4% of your costs with a lot of effort.)
  2. Are you focused on anamolies like this one or average profits per Rx?
  3. Do you have the right plan design in place?
  4. Do you have a MAC (maximum allowable cost) list both at retail and mail order for generics?
  5. Are you getting the rebates and any admin fees from pharma for your claims passed through to you at the PBM?
  6. If you pay the PBM on a per Rx basis (i.e., no spread allowed), what are they doing to keep your drug costs down year over year (i.e., they have no more incentive to push down on suppliers)?
  7. Are you benchmarking your pricing?  Look at reports from places like PBMI.  For many smaller clients, I often wonder if the savings they find you is worth the costs.

I’m sure there’s more since I’ve been out of the industry for a few years, but while I don’t intend to be the defender of the industry, I do like to bring some balance to the conversation.

Why CVS Caremark Asking For Your Weight Is Good For You

I continue to annoyed by all the fear-mongering in the industry around what CVS Caremark is “doing to their employees”.  What about focusing on how they are helping their employees to get better?  (If interested, you should read some of the information they have on their blog.)

Our “Plan for Health” combines an evolving, best-practice approach to health coverage with preventive care and wellness programs. Our colleagues will be more accountable for taking control of their health and associated costs. The first step is getting to know your numbers by getting a health screening and completing an online wellness review each year. If colleagues complete both by the May 1, 2013 deadline, they will avoid paying an additional $600 for the 2013-2014 plan year. (from the CVS Caremark blog)

I was hopeful to hear someone come out strongly and speak about it yesterday on CBS, but instead the CEO of Mercer just talked about “soft” programs that depend upon consumers being proactive around their health.  I would rather hear about the value of screenings and how it helps employees.  In talking with one friend of mine at a biometrics company, he told me that in one case almost 40% of the people that they identified with diabetes (or pre-diabetes) and hypertension (or pre-hypertension) didn’t know they had the disease (or were at high risk).  That to me is a valuable insight to the individual especially when coupled with a program to help them learn and manage their disease (or risk).

For example, companies for years have been using Health Risk Assessments (HRAs) to try to baseline employee health and use that to accomplish several things:

  1. Help the employee to understand their risks
  2. Identify people who should be in coaching programs to improve their health
  3. Learn about their population and how to improve their health benefits

Use of biometrics is the right evolution from the HRA.  People have tried HRAs for years with some success.  Companies pay as much as $600 for people to take this online survey that has no necessary link to reality.  Most HRAs aren’t linked to lab values.  Most HRAs aren’t linked to claims data.  Most HRAs don’t necessarily trigger enrollment in health programs.  They are supposed to activate the employee to be proactive which doesn’t work for many sick consumers especially those in the “pre-disease” phase.  (Here’s a good study that does show some increased activation.)

As I mentioned the other day, this use of biometrics and link between incentives and participation (and ultimately outcomes) is normal and will ultimately improve the link between the workplace and the employee around health.

Let’s take a broader look at insurance to help set some context:

  • For life insurance, you have to disclose certain data and depending on the policy level you have to do other things like get a physical and have blood work drawn.  That effects your costs and their underwriting.  
  • For car insurance, if you get in accidents, your costs go up.  In some case, you can have a monitoring device put on your car to lower your costs.  (like getting blood work done)
  • For home owners insurance, your costs go up if you live in a flood zone or a earthquake zone.  It also goes up if you have lots of claims.

Whether we want to admit it or not, we do determine a lot of our healthcare costs based on decisions we’ve made or had made for us since we were kids.  Some of these are conscious and some are subconscious.  And, obesity which is a large driver of many of these chronic conditions and has an impact on your likelihood of having cancer.  So, a company asking for your BMI and other data to help understand your risks for healthcare costs (of which they typically pick up 80%) doesn’t seem unusual.

Certainly, some are environmental such as those that live in “food deserts” like Detroit.  In other cases, workplace stress can affect our health.  We’re just starting to get smarter about “sitting disease” and it’s impact on our health.  Or, we may take medications that affect our blood pressure (for example).  It’s certainly important to understand these in context of your lab values and discuss a holistic strategy for improving your health with your physician and any care management resources which are provided to you (nurse, social worker, nutritionist, pharmacist).

This idea of learning more about employees in terms of biometrics, food, sleep, stress, social interaction, and many other data points is going to be more and more of a focus.  Companies want to learn how their employees do things.  They want to understand their health.  They want to improve their health.  They want to invest in their workforce to improve productivity, innovation, and ultimately job satisfaction.

While the glass half-empty people won’t see this and there are some companies that don’t always act this way, I generally believe that companies are trying to act in a way to increase their top line and most intelligent executives understand the correlation between health and wealth and the link between employee satisfaction and growth.

Ultimately, healthcare costs are estimated to put a $240,000 burden on us after we retire (even with Medicare) so if someone wants to help me become healthier and thereby save me money which improves my ability to retire and enjoy life I’m happy for them to do.

Takeda: Prescription Drug Benefit Report

Have you ever read the annual Takeda Prescription Drug Benefit Cost and Plan Design Report?  It is a great summary of data from 340 employers representing over 6M members and this version is based on data from May and June 2007.

Here are my notes:

  •  89% use tiered formularies.  [I am amazed that 11% still have a one-tier plan.]
  • Closed formularies (where drugs not on the list aren’t covered at all) have almost disappeared.
  • 11.1% of employers use mandatory mail.
  • Mail order penetration with mandatory mail is 27.3%.
  • 26.8% of employers use retail pharmacies to dispense 60+ day prescriptions.
  • 51.5% of employers require use of a specific specialty pharmacy.  (mandatory specialty)
  • 40-70% of the specialty drug spend is under medical not pharmacy
  • Flat dollar copayments still represent about 75% of plan designs
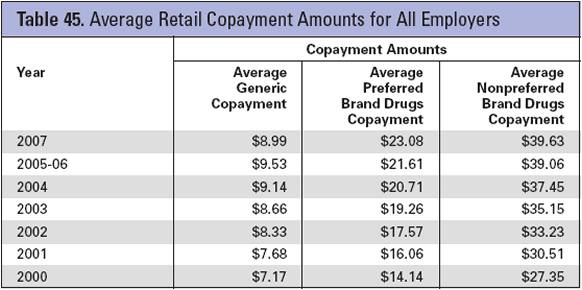
  • The average copayments for retail are $8.91, $23.08, $39.77 and for mail are $17.99, $47.89, and $81.07.

takeda-retail-copay-trend.jpgtakeda-mail-copay-trend.jpg

  • It talks a little about using lower copayments to increase adherence:
  • The Cleveland Clinic has a plan outlined here where they dropped their statin copayments dramatically from $75 and $90 for 90-days to $6 for a generic and $8 for Lipitor or Crestor.  The drugs had to be purchased from the clinic’s pharmacies.  Additionally, the employee had to split the pills (i.e., get a Lipitor 40mg pill and split it to get two 20mg pills) except for those who required the highest doses.
    • 38% of eligible members participated
    • Adherence went up 20% in year one
    • 50% of those that participated picked up all their prescriptions in year one compared with 18% of those that didn’t participate
  • The average pharmacy reimbursement rates as a percentage off AWP were:
    • Retail brand 16.1%
    • Retail generic 43.6%
    • Mail brand 22.7%
    • Mail generic 51.8%
    • Specialty 16.5%
  • For most, they still show an average dispensing fee although I thought that was gone in mail for sure.  (It says only 20% pay a dispensing fee at mail.)
  • The brand rates seem pretty reasonable, but I think the generic rates are pretty pathetic.  I thought it would be more like 50% retail and 60% mail.
  • The GFR (generic fill rate) ranged from 4.7% to 71% at retail and 1.8% to 71.4% at mail.  (Note that your GFR at retail should be higher as their are more acute generics.)
  • The average GFR was 54.5% retail and 41.7% mail.

takeda-grf-trend.jpg

  • The copay differential between tiers one and three makes a difference…at least at retail (what about one and two?):
    • If it is $25 or more, the retail GFR was 4.9% more and if it was $65 or more at mai, the mail GFR was 0.6% less.
  • The averages for Rxs PMPM and costs were broken out by active employee and retiree:
    • Rxs PMPM were 2.1 active and 3.5 retiree
    • Gross costs PMPM were 76.15 active and 146.23 retiree
    • Net costs PMPM were $55.52 active and $122.99 (with highest being 401.32 and 359.00)
  • Rebates per branded Rx (actual not guaranteed) were:
    • $2.57 retail
    • $10.79 mail
  • There is another case study insert about the University of Michigan’s pill splitting program for statins (aka cholesterol lowering drugs).
    • Participants save 50% on copay and get a free pill splitter
    • 500 people participated saving them $195,000 and the patients saved $25,000 in copays
    • According to their director of benefits, if 25% of eligible statin users split pills, they could save $740,000 per year
    • So, they must have had about 6% participation in the year one savings above
  • I was actually shocked by the number of employers covering some OTCs (which I think is great).
    • 83.9% cover Prilosec OTC
    • 79.3% cover loratadine (Claritin)
  • 76.4% use some quantity level limits
  • 75.8% use refill too soon logic (I thought this would be 100%)
  • The classes most typically excluded from coverage

takeda-drug-exclusions.jpg

  • It lays out the most common UM (utilization management) tools used including:
    • Disease mgmt 30.5%
    • Dose optimization 22.6%
    • Outbound phone calls 17.9%
    • Step therapy 35.5%

    takeda-um-tools.jpg

  • And, finally, it gives a lot of links for more information which I will post in another entry.