
 February 5, 2010
It’s been a while since I did all my analysis on the drug trend reports last year. It’s almost time for some of them to start coming out again. Prime Therapeutics typically publishes their document at the end of the season (see press release). (see my review of their 2006 trend report)
In general, I liked the report. It was an easy read and something that I think anyone could pick up and understand.
General Notes:
-
Prime is owned by 11 Blues plans and partners with 5 additional plans.
- $8.3B in drug spend under management.
- 27% annual membership growth
- 94% member satisfaction
- Prime’s drug trend (PMPM cost) decreased by 0.5% in 2008. (Specialty trend was only 0.9%.) This is their 6th year of single-digit trend which is great. [I really want to dig in and know why – population, drug mix, plan design.]
-
Their generic fill rate was 63.7% (in December 2008). [This seems low…CVS Caremark’s for the same period was 66.3%.]
- Some of this is plan design, but I think their average age is lower than other PBMs which would drive a lower GFR with higher acute drug use…which is more likely to be generic. [I’m speculating on age, but they share that their average age is 33 which seems low.]
-
1.1% of their total Rxs were specialty drugs.
- Neither here nor there, but they are the first company I’ve seen to show ingredient costs per day for specialty. (It was $75 vs. $2.50 for traditional drugs.) Most show costs as a 30-day supply.
-
Their average costs per Rx were $61.87.
- Brand = $132.65
- Generic = $19.20
- Their Rxs PMPY remained flat at 11.5 which still seems low to me. [They state that the average number of retail Rxs per capita was 12.6…does that mean it’s actually higher once you add in the mail Rxs and adjust for days supply?]
-
Their average member cost share was 26.4%.
- 27.2% for brands
- 40.1% for generics
- 5.0% for specialty
- For Medicare, the utilization is much higher at 47.9 claims PMPY.
- Their average age was 33.3 (commercial) and 72.7 (Medicare).
- The GFR for their Medicare business went up 8.7 percentage points to 71.3% which is a huge jump.
-
I like how they break traditional drugs into two buckets – Spectrum (not my favorite name) and Focus. This allows them to show different strategies on these two (vs. specialty).
- Focus are drugs for high blood pressure, high cholesterol, diabetes, respiratory disorders, and depression.
- They say they have a GFR of 34.9% in specialty. [This seems incredible. I didn’t realize there was that much generic opportunity but maybe I’m outdated here.]
- They show a chart on page 30 around generic fill rate which seemed strange to me. It shows the best in class sometimes exceeding what they consider the theoretical maximum. I think I understand why, but I’d have to challenge whoever came up with the theoretical maximum if I already have clients exceeding it.
- They have a Generics Plus drug list which I imagine is a lot like the High Performance Formulary which we had at Express Scripts and was part of my GenericsWork solution that I launched when I was there.
- They are the first PBM that I’ve seen recommend a $5 generic copay to try and avoid prescriptions being processed for cash and losing those claims for DUR purposes. I think this is great.
- I was surprised to find out they have a generic drug alert program. [A program telling me the drug that I’m on is now available as a generic.] They might be the only PBM I know with this. From a consumer perspective, I think this is great. From a business perspective, I know that almost all of these people will get switched by their pharmacy to the generic without doing anything so the value of that mailing is pretty limited.
- I was surprised to see them quote the Harris Interactive study from March 2005 on barriers for refilling medications. I like to see their data to compare.
- They have a section on value-based plan designs and provide three types of pharmacy solutions – drug-based, behavior-based, or risk-based. Sticking with their focus on risky patients, they recommend a risk-based model. I like this concept although I’m more of a behavior based advocate myself. They other question I have is can you offer lower copays for people at risk without having any type of “equity” issue with the other employees within the same plan?
- They have an Adherence Report which conceptually I like although it only goes out every 6 months. There is research out there that says intervening after a 14-day gap-in-care (i.e., lack of adherence) is important to get people back to therapy.
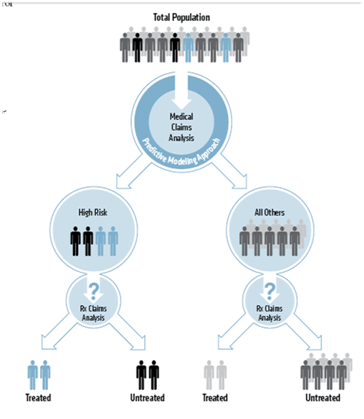
- One of my favorite images that they’ve been using for a few years is the one below. It shows using a predictive model to focus on at-risk members and allows you to especially focus on those that are at risk based on medical data, but have no Rx claims. (Something they can do with the ownership by the Blues and access to medical data.) [They say these people are zero percent adherent which is a term I’ve never heard anyone use before.]
Key Research Points:
-
For high risk patients (survived a heart attack or show signs of heart disease), one heart attack can be prevented for every 16-23 members who regularly take cholesterol lowering medication.
- 3.2% membership is high risk and not on a cholesterol medication.
- Patients who receive a targeted outreach are 3x more likely to begin therapy
- Every one percent increase in GFR (generic fill rate) has the potential to reduce pharmacy expenses by 1-2%. [Walgreens also used 2% in their drug trend last year which is higher than what I’d seen before.]
- They talk about increasing generic usage as likely to increase member’s adherence. [I think Dr. Will Shrank has shown in some of his research that those that start on generics are more likely to be adherent.]
-
I’d love more detail on the case study on page 9 so maybe I’ll have to read the references…BUT what it says is significant:
-
By getting 5,000 high risk members with high blood pressure to be compliant with a statin for 1 year, they saved $2.1M in potential medical costs.
- Avoided – 44 heart attacks, 5 strokes, 20 heart failure hospitalizations, and 8 kidney failure hospitalizations requiring dialysis
-
- There are currently 183 medications in development to treat diabetes and related conditions.
- Patients with type 2 diabetes are 2.5x more likely to be hospitalized if they do not adhere to their medication therapy.
- Those who report being non-adherent to their cardiovascular medications have a greater than two times the likelihood of having a heart attack, stroke, or other cardiovascular event.
- For every heart attack avoided thru proper use of high blood pressure or cholesterol medication, a plan sponsor could save approximately $30,000.
- Drugs for MS (multiple sclerosis) patients have a monthly cost of $2,200 (wholesale). 1 in 5 members with an out-of-pocket cost > than $250 declined to fill and they were 7x more likely to decline than members with costs of <$100.
Potentially Conflicting Statements: (you have to read these things closely to find this stuff)
- On pg. 21, they recommend a $10 copay for generics, but on pg 32, they say adherence is best when your generic copay is less than $10. Maybe two different questions, but seems inconsistent.
- On pg 32, at one point they say that every $10 difference in Tier 2 copayments leads to a 2.3% higher GFR and in another point, they say a 2-3%. [I might be missing something here since the two are worded slightly different.]
- On pg 35, they say that step therapy encourages members to use a generic alternative before a “second line, usually more costly brand medication.” I think this is meant to imply that it’s usually a brand drug versus it’s usually more costly. But, then on pg 46, they say before a “more costly medication”. It’s possible to have a generic as step one (or an OTC) than a more expensive generic as a step two, but I don’t think that’s very common. [For you clinicians, think H2 before generic PPI before brand PPI from a few years ago.]


George,
A very thoughtful and thorough review of our report. Thank you for taking the time. We are proud of many of the points you cited, and frankly pleased that you found it easy to read. You also asked some great questions, George. Here are two important clarifications for you and your readers:
•Prime’s overall drug trend in 2008 was 0.9 percent. If we exclude specialty drugs, the PMPM spend was negative 0.5 (-0.5) percent. We referred to this as “traditional drug” trend. Prime’s trend for drugs broadly classified as “specialty” was 9.1 percent.
•Our average generic fill rate in 2008 ranged from 61.6 – 70.7 percent. Importantly, this number reflects our entire book of business. It is not uncommon for our competitors to only report on a portion of their population (e.g., only those who have mail as well as retail). This range also reflects the variety of approaches Prime supports, since each of our clients takes an active role in shaping the pharmacy program to meet their specific objectives. As you noted, in our Medicare book of business we increased the generic fill rate 8.7 percentage points to 71.3 percent in 2008 through thoughtful benefit changes and regular, consistent member communication.
Again, George, we appreciate your close reading of the report. Thank you.
Regards,
Steve Blumenfield
Sr. VP and Chief Marketing Officer
Prime Therapeutics LLC