
 April 23, 2014
This is the “exciting” time of year when the PBM Drug Trend Reports come out. With the exception of last year, I’ve reviewed them every year. I reviewed the 2013 Express Scripts Drug Trend Report the other day, and I’ll try to do both the CVS Caremark and the CatamaranRx reports this week. The only one I’m still waiting to see is the Prime Therapeutics report. And, as far as I know, there aren’t any other PBMs that publish reports annually. (but please correct me if I’m wrong)
I’ll reiterate several points:
- The methodologies used by each PBM can and may vary. Therefore, these are not necessarily perfect comparisons.
- I would question whether trend is the right metric in isolation to view the PBM. (more to come in another post on PBM differentiation)
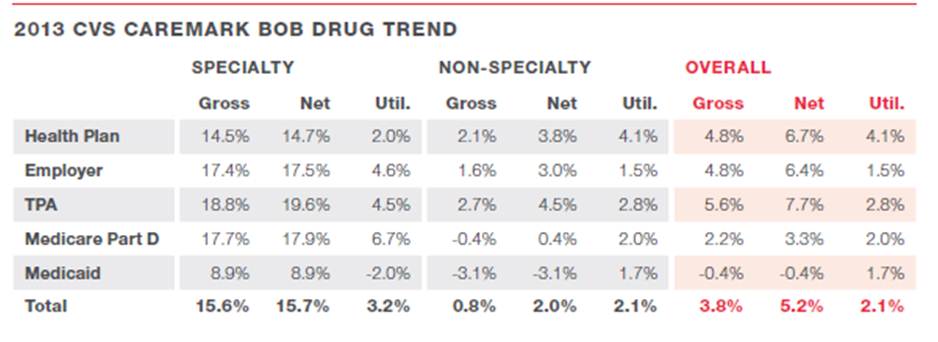
- The client mix by PBM does matter (see chart below from the CVS Caremark report this year which shows the differences by client type).
Here are the summaries from the 3 Drug Trend Reports showing the trend in PMPM costs based on traditional categories, specialty medications, and an overall trend.


Congratulations to the reader that caught my error here. They pointed out that I used the ESI Medicare trend numbers not the commercial numbers. I’ve corrected it now. Thanks.
George, thanks very much for doing these each year. I always find them interesting. Any thoughts on what Caremark’s distinction is between “gross” and “net” trend? I may be wrong, but I think they’re the only ones doing that. Happy Spring to you.
I’m not sure. I will ask.
Here’s the clarity from CVS Caremark on gross versus net.
Trend, a measure of cost growth on a per member per year (or per month) basis, is commonly reported by PBMs. CVS Caremark reports on both gross and net trend. Our gross trend calculation takes into account total prescription cost inclusive of the share paid by the member. Net trend looks only at our clients’ cost (without accounting for rebates), which means, net trend calculations are done minus the member cost share. Gross trend is the industry standard; it provides an overall picture of patterns of utilization and cost and how the total cost of prescription coverage changes.
In our client-specific reporting, employer clients tend to focus on gross trend, whereas health plans place priority on net trend. We believe both are useful. A comparison of gross and net provides insights into patterns of plan design and shifts in cost share. For example, in this year’s INSIGHTS report, our Book of Business trend numbers show net trend to be consistently higher than gross trend (except in our Medicaid lines of business). This indicates that despite the growth of Consumer Directed Health plans and increasing member cost share, payors are still bearing the majority of the overall cost increases. Part of the explanation for this is the impact of specialty pharmacy growth and that member cost share does not make a significant impact on specialty costs. As specialty utilization continues to grow, continued increases in net trend are expected.