Well…I better get this posted before all the 2008 reports start coming out. I have started it a few times, but there is so much good content in here that I haven’t finished. I am determined to get this done tonight. As you may know, all of the PBMs publish very well done annual research reports on the trends in the industry and what they have learned from their data. I have talked about Express Scripts research and reports (here, here, and here) and Medco’s report (here). [Note: For simplicity sake, I am not going to put all the sources here. They are in the Caremark
document.]
- Healthcare coverage and costs are the top domestic issue among consumers. (Kaiser Family Foundation)
“Consumers experience the [healthcare] system as complex, impersonal, disconnected, reactive, and increasingly unaffordable.”
- In 2006, the average number of retail Rxs per capita was 12.4.
- 59% of those <65 had an Rx in 2004 and 92% of those >65.
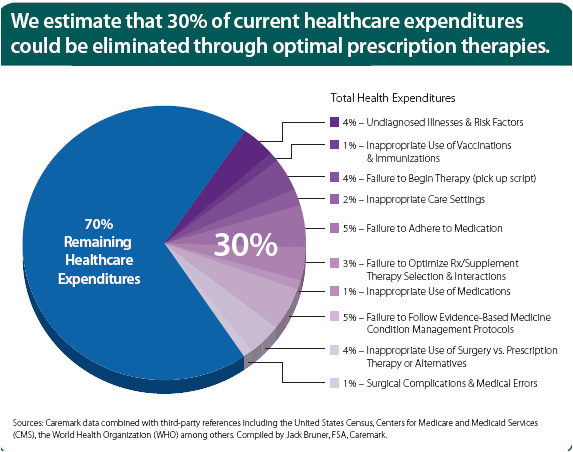
- With consistent use of effective prevention, early intervention, and adherence strategies, they estimate that 30% of current healthcare spending could be eliminated. Image the impact of that on MLR (medical loss ratio) which is a key metric for managed care companies on how much of each premium dollar they actually spend on healthcare costs.
-
They layout a very logical vision that would take advantage of their unique set of assets with CVS, Caremark, and MinuteClinic.
- Preference based consumer access.
- Patient focused view within their systems and communications.
- POC (point-of-care) connectivity. (i.e., pushing relevant information real-time to physicians and pharmacists to optimize care)
- Personalized health advocacy (“make the healthcare experience less disconnected and impersonal”)
- The price of brand drugs (on average) increased by a rate of 3x the CPI (consumer price index) in 2006…the highest since 2002. [In my opinion, this will continue as they face more price pressures with the government being the largest buyer now with Medicare Part D and with the majority of claims now being filled with generics.]
- At the same time, the price of generic drugs decreased by 1.2%.
- With Medicare, Medicaid, and other public payer, the government now pays 40% of the total drug spend in the US.
- They are working with the Coalition for a Competitive Pharmaceutical Marketplace (CCPM) to reduce patent expiration “loopholes” (aka ways that brand manufacturers extend their patent lifecycles which are often perceived to not add any additional value).
Some of the graphs and charts that I found interesting and helpful are below. (I pulled one of my favorites out in its own posting.)
(BTW – If you don’t know who BOB is, it stands for Book of Business which means the payors whose data was included in the analysis.)
(They make the point that 5 of the 10 drugs face patent expiration by 2010 so as expected prices are increased in the years prior to maximize return.)
I haven’t talked a lot about specialty drugs here on the blog. Here is a good list of the top classes. Typically these drugs are either high cost and/or require special care (mostly meaning injection). The average specialty drug would typically cost $1,500 per 30-day supply versus more like $80 for a non-specialty drug.

 January 28, 2008


Trackbacks/Pingbacks
[…] Comments Caremark’s TrendsR… on The Express Scripts Outcomes C…Caremark’s TrendsR… on What is a PBM?Big Brother on Nuclear Medicine – What???…rich on Would You Use a Pharmacy […]