I don’t post a lot of the information that I get from various press releases, but this one seems interesting. It ranks the top 10 and bottom 10 states based on Medicaid spending…which is obviously very relevant as we move to more people being covered by Medicaid and also has relevance on physician participation with Medicaid.
Sometimes I am surprised at what gets people to find the site and read a post. My favorite posts are very different from the most visited (not sure how to interpret that). [Note – I excluded my detailed reviews of publications (e.g., books and trend reports) which I do enjoy.]
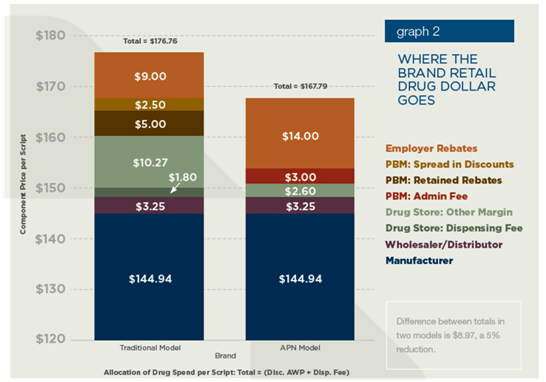
Milliman recently put out a whitepaper commissioned by ReStat on “Alternative Pharmacy Network” savings. My general opinion is that they use a lot of data and analysis mixed with some sensationalist statements to make the very obvious point that creating a limited or closed pharmacy network will save you money. (I hope they didn’t charge much for this.)
Net-Net: Limited or tier pharmacy networks are a great idea. ReStat is building on their experience with Caterpillar which is a great program. But, the whitepaper was flawed.
Their conclusions were:
Potential Savings – The analysis shown in this report suggests that APN programs can offer a significant savings to employers relative to traditional networks. For an assumed range of consumer use of participating pharmacies, an employer with 10,000 lives could save $200,000 to $620,000 per year, depending on benefit design, without changing cost-sharing structures (see Table 3). Benefit design changes could increase or decrease the savings. A closed APN network (no coverage for non-APN pharmacies) would increase savings for a given benefit design.
Sources of Savings – In our analysis, the APN model can achieve lower cost because the PBM and retail pharmacy retain less revenue.
The Value of Limited Networks for Pharmacies -For medical benefits, health plans use network providers as part of overall quality and efficiency programs and are promoting network programs such as medical homes and pay-for-performance. Sponsors and PBMs can extend the advantages of networks to the pharmacy benefit. However, the ability to obtain value in a locale depends on the willingness of some pharmacies to participate as network members.
Plan Design Changes – Plan sponsors may need to change their plan designs to encourage use of the limited network. For example, the copays for limited network pharmacies may need to be decreased (from current levels) and/or the copays for non-network pharmacies may need to be increased to create a benefit differential between the network and non-network pharmacies. These plan design changes could reduce or increase the projected savings of a limited network, depending on the specific change.
My comments about their analysis:
They assumed that retail pharmacies would reduce their spread on generics by 44% (and brands by 78%) to be part of a limited network. That might be true for a large client with geographic concentration and for a retailer with low market share, but I think that’s a leap. (see chart below on brand pricing assumptions)
They say that spread for retail claims for PBMs can be 10-15% of AWP. I’ve seen plenty of deals that were negative (at least on brand drugs). In many cases, spread pricing doesn’t even exist.
They claim that PBM’s make money “(as part of a typically Drug Utilization Review program) actively encourages patients to switch to different medications as a core part of its business.” Really. That went out with the AG settlements back around 2004. Chemical substitution to generic equivalents certainly happens, but using DUR to push therapeutic conversion. I don’t think so.
They claim that PBM’s will buy drugs and repackage them to get a higher reimbursement rate at mail. I’ve never seen it (but that doesn’t mean it’s not done).
MAC pricing at mail. Yes. PBMs do make most of their money on generics at mail, and I’ve talked about the need to align your MAC lists at retail and mail before.
They also say “While mail order presents the opportunity to save sponsors money, attempts to encourage mail order by reducing copays could increase sponsor cost if the benefit plan is poorly designed (e.g., copays are reduced too much), utilization increases, or generic dispensing decreases.” I’ve talked about why clients lose money at mail before, but I’m pretty sure that there have been plenty of studies that show adherence improves (not unnecessary utilization). Studies have also shown that if you adjust for acute medications at retail then the generic dispensing rates are very comparable at retail and mail (or explained thru population differences).
They claim that the PBM’s make 10-15% on specialty drugs that they dispense (which seems high to me) and then use $5,000 per month as a number when the average 30-day supply of a specialty drug is more like $1,500.
They claim “Different manufacturers offer different rebates, which may factor into a PBMs decision making.” I think if you read the P&T process documents you would see that decisions about in or out are made based on clinical decisions and then a formulary can be broad or narrow based on the net price to the plan sponsor which does (and should) evaluate rebate impact.
They quote a source saying that 35% of rebates are kept by PBMs. Again, that seems really high. In my experience, there was an administrative fee equal to several percent of the AWP of the drug that was kept but the rebate dollars were passed to the plan sponsor.
While I like the simplicity of the flat fee payment model (i.e., I pay my PBM $3.00 per claim), it certainly creates no incentive for them to do better year over year in improving their negotiating with pharma and retailers or to worry much about trend management.
They talk briefly and seem to encourage ReStat’s Align product which seems like a very logical approach (used by other PBMs also).
Restat configures custom retail networks and benefit designs that create incentives to encourage member use of alternative in-network pharmacies and allows consumers the ability to shop based on price as well as service. Non-network pharmacies are also available but at a higher copay or costs.
It looks like the concept of “Select” Home Delivery which has been one of the products to come out of the Consumerology approach at Express Scripts is about to get some cousins such as Select Step Therapy, Select Networks, and Select Specialty. Obviously, the concept of Active Choice has legs. (I understand the networks and specialty, but I’m not sure what the step therapy product will look like.)
The concept of choice has to do with the decision framework with which options are presented. Making it active choice typically refers to the requirement of the consumer having to make a decision. They can’t do nothing. This doesn’t mean that the company can’t select a default recommendation, but it can’t implement that option without the consumer verifying it. (See the book Nudge for more details on this concept.)
He does a great job of aggregating data, looking at trends, creating great charts, and providing an informed perspective on the industry. Let me just pick out a few things to highlight from the report:
He predicts four trends:
Market growth and shift to specialty
Boom-to-bust for generic drugs
Cost-plus pharmacy reimbursement
Preferred pharmacy networks
He talks about the concentration of specialty pharmacies and the fact that 81% of health plans require their members to use 1-2 specialty pharmacies.
He talks about the shifting market share among retail pharmacies and the fact that while only 31% of urban and suburban pharmacies are independents that number jumps to 65% in rural areas.
He talks about the AWP discount that plan sponsors realize at retail compared to mail and how that gap has 58 basis points in 2010. (A key fact in understanding why you have to have the right plan design to save at mail.)
And, one point that I often make (without the exact data) is that people paying cash for prescriptions pay too much. He shows that the gross margin for cash patients at independent pharmacies is a whopping 54% compared to 20% of less for other 3rd party and government reimbursed scripts.
Here’s an example of one of his charts (exhibit 34).
My final commentary on the report is that this should be a read for people trying to work in the industry or new hires in the PBM or retail management. I’m pretty sure all the analysts on Wall Street already read it.
A friend sent me a link to this earlier today (HMO PPO Rx Digest). I haven’t read thru the whole report yet, but they have some slides you can download and see the graphs. I downloaded them and posted them on Slideshare for others to easily view. Here you go.
The survey was across 380 organizations plus 100 consultants and brokers. And, the survey was conducted prior to health reform passing so that’s an important timeline to keep in mind. It’s a nice quick read with lots of stats and charts from the survey with comparisons to last year’s numbers.
Executive Summary:
Less than 40% said they were extremely or very concerned about economic conditions affecting their ability to offer the same level of prescription benefits over the next 2-3 years. (down from 60%)
Plan sponsors are increasingly eager to find cost control solutions:
90% – promoting the use of formulary products (brand and generic)
80% – encouraging the use of mail order
83% – helping members make more effective healthcare choices
76% of plan sponsors state that balancing costs with care is the key philosophy (which is a reversal from 5 years ago where it was providing broad coverage)
Respondents see pharmacy as representing 22% of their overall costs (a higher number than I’ve seen before so I’d like to see actual data here)
Surprisingly, plan sponsors were more concerned over DTC advertising and minimal attention to personal health than aging and use of specialty drugs
72% EXPECT their PBM to help reduce overall healthcare costs (what I’ve been saying for a few years)
79% say that specialty pharmacy is better managed by the PBM than the health plan
The 9 leading trends:
A transformative shift in benefit philosophy continues
Rising costs replace economic woes as key affordability issue
Plan sponsors prefer targeted but limited government employment
Use of integrated data is becoming standard practice
CDH plans are struggling to gain momentum
Specialty medication management programs are increasing sharply
Generics and preferred drug programs moving from incentives to mandates
Decisive move towards stronger mail incentive programs
Plan sponsors look to PBMs to reduce overall healthcare costs
(The ones that surprised me here were #4 which I just haven’t seen significant movement on and #7 where I haven’t seen much in the way of mandates, but I’m on the outside looking in these days.)
#1: Transformative Shift in Benefit Philosophy
Only 6% are focused on limiting coverage
Honoring retiree commitments is still the #1 factor in guiding retiree benefits
95% of benefit advisors agree
#2: Rising Costs as Key Affordability Issue
72% blame physicians for complying with patient requests for more expensive branded medications
52% believe that engaging members to make better health and cost related decisions is their number one priority (which is exactly what Silverlink does for clients!)
95% of benefit advisors agree
#3: Targeted but Limited Government Involvement
60% say the government should have minimal or no role in providing prescription benefits (only 15% preferred a private plan)
71% want the government to help bring generic biologics to market faster
42% believe the government should mandate e-prescribing initiatives
75% of benefit advisors agree that government proposals will help lower Medicare Part D costs
#4: Use of Integrated Data
64% use integrated data to improve health and financial outcomes (I would guess much of that is outsourced to 3rd parties. This also still doesn’t include lab values.)
74% do it to improve case management
70% do it for disease management
68% do it to identify members at risk
95% of benefit advisors agree on the likelihood of recommending data integration over the next 2 years to control drug costs
#5: CDH Plans are Struggling
27% of respondents offer a consumer-directed health plan but 73% say their members are reluctant to join
It was virtual tie between those that thought CDH plans helped reduce Rx costs and those that didn’t…but the majority of people agreed that they help employees better understand the real costs of healthcare
67% of benefit advisors agree on the likelihood of recommending a CDH plan over the next 2 years to help control costs (which seems out of line with the employer perspective)
#6: Specialty Medication Management Programs are Increasing
83% of respondents plan to install clinical and cost-management programs to help contain the cost of specialty medications
40% cite specialty as the key cost driver
Respondents believe that billing under the pharmacy benefit:
Provides more consistent pricing (79%)
Provides a better understanding of therapy management savings opportunities (77%)
Provides a more complete and accurate picture of specialty spending (80%)
The programs being used are:
Utilization management (64%)
Limit days supply (63%)
Preferred pharmacies (58%)
Step therapy (55%)
Move coverage from medical to pharmacy (41%)
Waive copayments to increase use of a preferred pharmacy (9%)
76% of benefit advisors agree on the impact of UM programs controlling specialty drug costs
#7: Mandates Over Incentives For Formulary Agents
58% are requiring the use of generics and preferred drugs (does this mean going back to closed formularies?)
90% use programs that incent (i.e., lower copays I assume)
94% are likely to increase member communications to encourage the use of generics
63% of benefit advisors agree on mandating the use of generics to control costs
#8: Stronger Mail Incentive Programs
58% have installed programs where the member pays more at retail after a set number of refills (I think this is a Medco anomaly…they’ve always had the highest mail utilization)
85% have a cost-share strategy that favors mail
38% waive one or more copays as an incentive to move to mail
5% auto-enroll members in mail
54% believe dispensing errors are less likely at mail (while 7% believe retail is better)
Mail order is seen as having a better chance to maximize generic use (by a 5:1 margin over retail)
69% of benefit advisors agree that dispensing errors are less likely at mail than retail
#9: PBMs and Overall Healthcare Costs
Why use a PBM:
More focused and experienced at controlling drug costs (88%)
Most competitive drug prices (88%)
Provide detailed analysis and reporting to help explain cost drivers and identify savings opportunities (87%)
More innovative approaches to controlling costs (83%)
After cost control of Rx, what do they look for in a PBM:
More effective in promoting adherence (69%)
Helps control overall healthcare costs (72%)
Better medication counseling (70%)
Benefit advisors believe the following are the most critical priorities for plan sponsors:
Engaging members (39%)
Controlling specialty costs (24%)
Ensure the pharmacy benefit supports a broader health strategy (20%)
One my flights over the holiday, I had a chance to read the 2010 Specialty Pharmaceuticals Facts, Figures and Trends. This is a publication put out by the Center For Healthcare Supply Chain Research. The data represents survey data from manufacturers and distributors from surveys sent out in March 2010. I pulled a handful of things that caught my eye into this post, but there is a lot more in the report that manufacturers and distributors would be interested in.
Overall Market:
Global market for specialty pharmaceuticals is $144B (7.5% growth).
US specialty pharmaceuticals market is $64B (4.9% growth).
Survey Data:
Anticipated 2010 growth rate is 8.4%.
Half of distributors specialize in specific disease states.
All distributors claim to specialize in oncology and 2/3rds in RA. The next big focus areas are Autoimmune (including HIV/AIDS) / Immune, CNS (including MS), and Hematology.
The biotech drugs in development by disease area (from PhRMA 2008 Report):
Cancer 254
Infectious Disease 162
Respiratory 27
Cardiovascular 25
Blood Disorders 20
Diabetes and metabolic 19
Nearly 60% of distributor’s product sales are distributed to independent clinics owned or operated by physicians. Only just over 20% are distributed to specialty pharmacies. (This was a shocker to me.)
From a storage perspective (based on SKUs not volume):
41% require refrigeration
2% require a freezer
6% have to be stored in a cage
4% have to be stored in a vault
From the distributors:
Avg # of orders per day = 2,153
Avg dollar amount per order = $10,503
¾ of distributors with revenue streams below $1B use refrigerated boxes while none of those with revenues > $1B do…but all of them regularly use ice packs and insulated boxes.
A temperature monitor is used on 47% of the shipments
A humidity monitor is used on 17% of shipments
Manufacturers buy insurance always in 38% of the responses and 13% of the distributor responses. 50% of the time, in both cases, insurance is never bought.
One question which I found very interesting was what services they provide (by % of manufacturers):
Now, from a distributor perspective, what services they offer:
75% offer call centers (I thought this would be 100%)
14% offer disease management
50% offer loyalty / incentive programs (this seems high to me)
38% offer MTM
38% offer refill reminders (why wouldn’t this be 100%)
Distributors reported an average of 1.4% of specialty units returned.
Manufacturers reported an average of 1.6% of specialty unites returned.
73% outdated
22% short dated
4% damaged
38% of distributors collect HIPAA information and share it in a de-identified and aggregated manner with manufacturers (with 60% of that information being at the dispensing location level).
Adherence
Disease
Filling location
Dosing
Physician information
Treatment plan
Treatment facility
Oncology makes up 60% of the sales volume for the distributors.
Nearly 8% of cancer survivors admit to putting off medical care and 11% skip taking their medications due to cost
One very interesting insight was that some physicians prescribe an IV-administered agent rather than an oral medication to allow the patient to be monitored. (I wonder what the cost / value tradeoff is here.)
Again, I’m a little late on this story (too much work), but I was thinking about it after the CMS news recently that they were going allow plans with a 5-star rating to have an open enrollment season all year round. That’s a huge deal.
(If you’re don’t know what the Star Ratings are about, see the Kaiser Family Foundation piece on What’s In The Stars or if you’re working on improving your Star Ratings, you can see Silverlink’s Star Power solution.)
If you missed it earlier this year, Humana announced that they were partnering with Wal-Mart to offer the lowest national plan premium for 2011 for standalone PDP plans (see details). Consumers who select the plan will get a lower copayment when they use Wal-Mart pharmacies. (I’ve talked about limited networks before so it will be interesting to see if this gets more to be offered in the marketplace.)
This creates a network with 4,200 preferred pharmacies and 58,000 non-preferred pharmacies. Personally, I’m still surprised more people haven’t gone to the $0 copay for prescriptions at mail which Humana offers in this plan (for tier-one and tier-two). United Healthcare has recently rolled out a program called Pharmacy Saver which has some similar attributes to the Humana plan.
So, has it made a difference? We won’t know yet. I would expect it would. The economy is still tight. Seniors are budget conscious. Humana has good brand equity. Wal-Mart, especially in certain geographies, is frequented heavily by this population.
Medicare open enrollment is from November 15th thru December 31st. This certainly caught everyone’s attention when it launched. (You can see some of Adam Fein’s comments when it first was announced and here’s a more recent AP article on the topic.) In a few months, we will know a lot more.
This came out a few months ago, and I’ve been carrying it around for a while. (Here’s the summary.)
I read section 9 which is about the prescription drug benefits. A few facts from the report:
Almost 3/4 of people have copays (i.e., flat dollar amount) versus co-insurance (i.e., percentage of cost).
The average copayments were:
$11 first-tier
$28 second-tier
$49 third-tier
For co-insurance, the payments were:
17% first-tier
25% second-tier
38% third-tier
13% of workers had a plan with four or more tiers
5% of workers have plans were the cost sharing is the same regardless of drug chosen
One of the more interesting things I saw is that average copays on first and second tier drugs are going up while the average coinsurance is going down. Not much but directionally interesting.
Adam Fein was kind enough to send me an updated chart of the one I posted yesterday that comes from his new report “The 2010-11 Economic Report on Retail and Specialty Pharmacies” which will be available December 7th here – http://www.pembrokeconsulting.com/industry-reports.html.
One of the interesting things that isn’t clear in the industry is that while mail order made significant gains in the past decade, the IMS numbers show negative growth over the past few years. On the flipside, mail order numbers and new users are still a big focus across the PBMs. It begs the question of whether mail order growth without intervention programs is negative and only those with an effective retail-to-mail strategy can replace and potentially grow mail faster than people organically leave.
It also begs more discussion on the topic of retention which while a hot topic for a while hasn’t manifested itself in many rigorous programs as of yet (to my knowledge).
From an article in USA Today, it sounds like tele-prescribing or virtual prescribing is making some steps forward. It’s no longer a scam business set up to allow people to skirt the system but a legitimate set of online companies leveraging technology to make it easier for patients. It will be interesting to see how this plays out.
With big companies and start-ups working in this space, it will likely take the same route as the clinics have taken in getting physician support although most of these described in the article seem to have physician involvement. Will they protest their peers?
Eventually, this won’t even be a debate as we can use home monitoring devices that plug into our computer or smartphone or iPad app to tell temperature, blood pressure, and other key statistics. I can see some cool scenarios being explored about how to allow the physician to do a virtual physical exam to complement the patient reported data. I can also believe that an online record of the patient’s symptoms will be easier to pull into an EMR / PHR than the physician’s notes.
The one thing the article doesn’t bring up is why the physician isn’t accessing a PHR (personal health record) to conduct the exam. I would think that should be a requirement for patients to use this. Make them go thru the step of pulling their history into an online tool and adding data about OTCs and allergies. Then, the virtual consultation would have a physician with all (most) of the data readily available.
You match that with some specific symptoms, some realtime data, and you have a recipe for improved care.
The three companies that the article mentions are:
Apparently, there is a trend toward smaller homes (although I don’t see it out in the burbs). The median home size has dropped from 2,300 square feet in 2007 to 2,100 square feet with more than 1/3 of Americans saying their ideal size is below 2,000 square feet. (stats from article)
This makes me wonder if having less room will encourage people to get out of the house more. Go out in the yard and play. Go out to the gym. Be more social.
Will this encourage more neighborhood interaction? Since we know that social pressures affect our decisions around smoking, eating, and exercise, this would seem like a good thing.
It would be an interesting thing to study at a macro level.
I’m catching up on a few things this week. One of those is sharing my notes from the CVS Caremark Insights 2010 publication (their drug trend report). While this year’s report outlines all of the traditional things you would expect – trend, spend by condition, market conditions, generic pipeline, I really thought the exciting information was at the end where they really begin to stitch together the retail / PBM model. I’ve talked about why I believe in this model so strongly in the past (you can also see some of their executive’s comments here). And, I think my perceptions about the future of pharmacists create lots of opportunity for a combined entity. I also think they hint at some of the insights they gained from research around non-adherence and around abandonment which is important and creates a foundation for them around predictive modeling and focused interventions.
I like that this year’s publication starts with a letter from Per Lofberg (the new President). He has brought them a renewed perspective on the PBM within the overall CVS Caremark enterprise which I think has been very helpful for them in this year’s sales cycle. [I personally haven’t met him yet, but I’ve heard a lot of good things about him.]
This introduction talks about:
Generics, specialty, and genetic testing as key trends
Controlling costs thru – plan design, clinical strategies, and negotiations with the manufacturers and retailers
Executing flawlessly
Improving outcomes
I like the fact that they introduce the outcomes focus early on. I think that linking themselves to outcomes given their unique footprint (retail, PBM, clinic) is critical for long-term differentiation.
Much like I see at Prime, CVS Caremark is a company that is blending its long-term team with some new leadership from outside the company and from the retail side of the business to drive innovation and change. I believe the clients and market has seen some of those changes already.
A quarter of their clients maintained a gross trend of less than 3%.
I found it interesting at the beginning of the document where they talk about the recession and macro-economy where they mention the effect that the COBRA subsidy had on health consumption.
They say that their member contribution is 15.7% which seems really low to me, but that is pulled down by the Medicare average.
As everyone has talked about, one of the big drivers of cost this past year was significant price inflation (9.7%) for brand drugs.
Their generic dispensing rate (GDR) in Q1-2010 was 70.4%.
Their average specialty trend was 11% with a best-in-class trend of 7.3% which seems really low.
Not a big surprise, the top classes are similar to other PBMs with large commercial populations. Here’s the list of the top 10 categories:
They mention later on their managed Medicaid lives (which I didn’t even know that they had). I think this should be a good growth area along with their Medicare Part D (PDP) lives.
They introduce a new methodology which I like which looks at trend by group – employers, health plans, TPA, and Medicare. There are differences in each so being able to compare to a relevant peer group is valuable.
They also talk about another change which is looking at book-of-business (BOB) which represent their top clients which represent 65% of total drug spend.
Their average gross trend was 3.4% (or 2.4% if you exclude specialty).
Digging into the best-in-class numbers is interesting. For example, for employers, 78.6% of their days supply was filled at preferred channel pricing (mail order or 90-day retail). I assume this is essentially for just maintenance drugs, but it seems really high (which is good) and is a new metric for me to think about.
They talk about 77.7% of hypertensives (in employers) being optimally adherent (which I assumes means having and MPR > 80%). This seems pretty good, but I don’t have an industry number to compare to.
“With overall goals of reducing health care cost and improving member outcomes, health plan respondents in our 2010 benefit planning survey placed high value on proactive member outreach (93 percent), multi-channel access for members (87 percent) and opportunities for face-to-face consultation (73 percent)—all factors that can help keep members on prescribed therapies and satisfied.” (page 14)
For each segment, they give the distribution of trend numbers. Here’s the one for health plans:
The best-in-class Medicare and Medicaid number for Generic Dispensing Rate are high and set a high goal:
78.2% Medicare Part D
86.8% Medicaid
Member retention is critical and involves a balance of copay levels, premiums and drug coverage as well as less tangible factors. Member satisfaction plays a significant role in loyalty and re-enrollment. High-performing plans focus on effective member communication and outreach as well as added-value services such as the CVS ExtraCare Health card.
They talk about using a split generic tier design for Medicare to allow for different member copays for higher priced generics. I think this makes a lot of sense, but I don’t know all the details or member data and feedback to really understand how it plays out.
I’ve never spent much time on Managed Medicaid, but they give a few numbers here:
Their average age is 17.6.
The average PMPY spend is $288.
Several times they use the term “evidence-based” which I really like. I recently was using that term to refer to communications and talking about how to leverage data to create “evidence-based” communications to consumers.
They provide a nice 2-page summary of reform.
They put out a short list of recommendations:
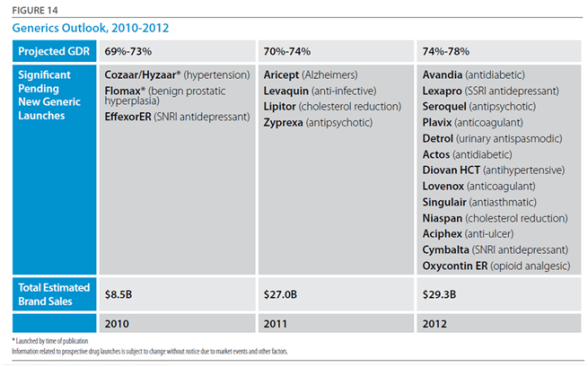
Prepare to take advantage of pending new generics; evaluate plan design and communication strategies for quick mobilization when new launches are pending. (This will be a big year for this with Lipitor.)
Many specialty pipeline products are for orphan diseases and will have narrow indications; have plans in place to ensure appropriate utilization. (This will continue to be a bigger and bigger issue.)
If you haven’t already done so, investigate the use of genetic testing to help guide treatment decisions. (Given their relationship with Generation Health this is an area that I expect to hear a lot more about in future Insights publications.)
Newer, more expensive pharmaceuticals may offer little advantage over existing products in the class; consider step therapy or preferred product strategies. (I think Utilization Management (UM) activities like Step Therapy (ST) will be a continued focus for the next few years especially as biologics allow these “traditional” techniques to be applied to specialty.)
Use wellness and preventive programs to identify people at high risk for chronic disease and help them lower their risk profile. (This is an area that I would have liked them to talk more about. As I’ve said many times, this is an opportunity for them to shine and differentiate.)
Members with chronic disease who are non-adherent tend to have higher health care costs; evaluate your population’s adherence levels and the support you provide to help people stay adherent. (Differentiation in this area is a huge opportunity. I think they are doing some interesting work in this area as they’ve talked about in some recent press releases – Rx abandonment, barriers to diabetes care, US Airways program, and behavioral research.)
They provide a forecast on trend for overall, non-specialty, and specialty. Here’s their forecast for the overall trend.
They give a clear chart on the generic opportunity and likely impact on overall generic fill rates for 2010-2012.
They go on to talk about specialty drugs which could be as much as 50% of the total spend by 2013…a scary prospect.
They have a good “state of the union” for specialty in the deck:
As of January 2010, 57 percent of all late-stage pipeline drugs fell into the specialty area.
71 percent of applications for supplemental indications are for specialty products.
The number of new specialty drugs approved in 2009 was more than double the number of 2008.
Provenge, the first therapeutic vaccine—which utilizes the patient’s own DNA and stimulates the immune system to fight prostate cancer—was approved early in 2010.
Potential approvals 2010-2012 include four new products for multiple sclerosis (all oral), three for hepatitis C, and three for cystic fibrosis.
18 of the products pending approval in 2010 target orphan diseases, which currently have few or no treatments.
While health care reform legislation provides for a pathway for approval of biosimilars, it also mandates a 12-year minimum exclusivity period for brand innovators with the possibility of additional exclusivity in 12-year increments for the development of new uses.
They then talk a little about pharmacogenomics (PGx). Again, I expect this to be a much bigger area in the future. It’s interesting. It’s changing rapidly. BUT, there is a huge education mountain for patients and MDs.
For a 1M member population, ~$12M is spent each year on 18 drugs that are administered to patients who do not respond and/or who are more likely to experience drug-induced medical complications.
I think some of the hidden gems begin on page 27 where they talk about their study on electronic prescribing:
22.1% never filled their first claim. (why – samples?)
They found that those who had an eRx were most likely to fill than those with a paper Rx. (I personally would have bet on the other…i.e., that I have something physical in my hand that it would serve to remind me to go to the pharmacy.)
Another study towards the end was on abandonment (which they recently released more information on). It showed that copay, income, and whether it was an NRx (new start on Rx) were predictors of abandonment.
They also share work done around adherence focused on complexity of therapy – number of Rxs, number of MDs, number of pharmacies, and synchronization of refills. They talk about using this to score patients and predict risk of non-adherence. (I look forward to seeing more here since this seems very interesting especially in terms of focusing resources and developing a triage model.)
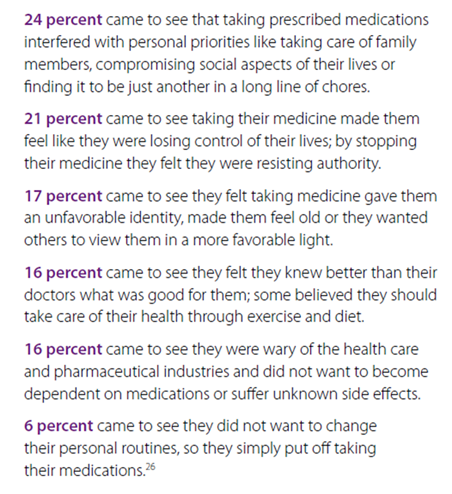
They shared the results of a deep dive on reasons for abandonment of prescriptions. Being able to respond and position messaging around these reasons is important.
They share some of the work from their Pharmacy Advisor program:
IVR messaging improved the odds of refills by up to 70.6% when members answered the phone.
Early IVR refill reminders were 2x as effective for first fill persistency rates at mail as compared to reminders after refill due dates.
Physician directed fax alerts about gaps in care nearly doubled gap closure rates.
Pharmacist interventions were most effective at improving adherence.
Members in VBID (value based insurance design) in which copays were lowered or eliminated were more likely to initiate therapy, less likely to discontinue therapy, and had better adherence.
“Diabetes is one of the most prevalent and expensive chronic diseases in the nation, costing the U.S. an estimated $174 billion a year,” said Troyen Brennan, MD, MPH, EVP and Chief Medical Officer of CVS Caremark. “The Pharmacy Advisor program improves clinical care because we are able to identify and address pharmacy-related care issues that if left unattended could result in disease progression and increased health care costs. We are also better able to engage the member in their care through multiple contact points, providing counsel that can improve adherence and help members optimize their pharmacy benefit and find the most cost effective options.” (quote from press release)
They talk about a pilot program they did in Polk County were patients signed a contract for care and was focused on diabetes care. It had some great results:
Reduction in blood glucose levels from 52% under or equal 7% at the beginning to 72% after one year.
30% reduction in hospitalizations.
24% reduction in ER visits.
Only 3.4% of enrolled members had poorly controlled diabetes (compared to national average of 29.4%).
Improved patient care – identification of potential adverse events, streamlined medication regimens, and formulary support.
(I personally would think this would get other plans (or PBMs) to partner with them on regional strategies where they have a strong retail presence.)
This also coincided with their announcements about their Pharmacy Advisor program which officially launches in January 2011. I’m very interested to see the uptake here which I would imagine will parallel the success of Maintenance Choice. This is a program which leverages their Consumer Engagement Engine (see image from last year’s report) and their retail presence to engage consumers.
Overall, it was an easy read without a lot of fluff. It cuts to the chase and gives you a good perspective on how they think. You begin to get a feel for what they are doing differently, but I imagine that you’ll continue to see a lot more research and case studies come out in the next year about some of the work they are doing.
(Note: In the sense of disclosure, CVS Caremark is a stock that I own.)
I am way behind this year in getting thru the Drug Trend Reports and posting my comments. I think I still have to do both the CVS Caremark report and the Walgreens report…and if I can get it, the SXC report also. (You can see my thoughts from the Medco and Express Scripts Drug Trend Reports earlier.)
A few things I’ve found interesting this year were that Medco reached out via their PR group to engage me and several other bloggers in the space. And, Prime Therapeutics has always been very active in engaging me around my thoughts on their report (see comment from last year) and continued to be proactive in discussing it with me and sending me a hard copy to read on the plane.
Overall, I think their Drug Trend Report continues to improve year after year. It’s interesting in that this year I found the tone slightly more aggressive in talking about them versus their competition. Certainly, Prime is going thru some changes (if you haven’t noticed). They brought Eric Elliott on board who I think very highly of after hearing him speak and engaging him on a few topics. Eric has brought in a set of core people from Aetna, Cigna, Express Scripts, and other places to complement an existing management team that really understands the market and how to work with the Blues owners. [I personally think of them (and MedImpact or SXC) as a dark horse would could consider bidding on the Walgreen’s PBM lives while everyone is pretty focused on it being either Express Scripts or Medco.]
If you don’t know, Prime works with 17 BCBS plans who are either owners or clients. They managed $9.1B of drug spend in 2009 and had 15M members.
Their overall trend was 3.4% which is good. Everyone’s trend was generally low this year although I continue to question if this is the right metric for the industry. I also wonder if they will embrace the outcomes based rebating that Eric did with Merck at Cigna.
Early on they talk about one of the ways they manage trend being through adherence and not manufacturer programs. I might be out on a limb here, but I believe manufacturer funding on adherence programs (especially in specialty) is a good thing.
They are always quick to point out that they report drug trend across their entire book of business not a random set or using any other cut of the data.
They share some early analysis looking at medical claims where they identified that 1/3 of people with diabetic complications had no recent diabetes prescriptions. A gap-in-care intervention opportunity.
They also shared a study that I hadn’t seen published that members using a 90-day supply of medication (retail or mail) were 40% less likely to stop taking their drugs than those using a 30-day supply. That’s a big difference.
Interestingly they source a study saying that their members get Rx refills a day faster than competitors. Again, that’s a big difference.
Generics were 67%. (in 2009)
They talk about their MAC list (Maximum Allowable Cost) which is used to manage the cost of generics in the payment terms with the retailers. They are the only PBM that I’ve ever seen do this.
Their average costs per Rx were:
$145.51 Brand
$18.21 Generic
$62.40 Overall
They talk about the need to establish out-of-pocket (OOP) maximums for higher cost drugs. I AGREE!
1 in 6 cancer patients with high OOP costs abandon treatment
Capping OOP at $100 reduces abandonment to 4.9%
They (like others) discuss the impact of rising drug prices primarly around brand products.
I had an interesting discussion with a reporter at the NY Times yesterday on this where he talked about manufacturers essentially paying the entire copay (20% of a $100,000 drug) to keep it getting filled.
They projected that the GFR (generic fill rate) would exceed 70% by the end of 2010 which I suspect will happen (if it hasn’t already).
It was interesting that they layout their pharmacy benefit for their employees. That would be an interesting one to come across PBMs. How do they treat their employees? What do they recommend? Do they take their own advice?
Generics were 10% with a $4 min and $10 max
Mandatory generic policy
Step therapy
Specialty medications had a 13% trend while representing less than 1/2 percentage of the overall prescriptions processed…but they did account for 12% of the cost.
Prime’s members filled 11.8 prescriptions per year (2.5% increase in utilization).
Prime’s Medicare trend was -5.6% with utilization of 48.2 Rxs PMPY. The average age for their Medicare lives is 73 (compared to 33 in the commercial lives).
As I’ve talked about before, I like the way they break out their “Focus” drugs which are drugs used to cover diabetes, high blood pressure, high cholesterol, respiratory disorders, and depression. These are categories with clear value propositions around adherence and are often co-morbidities.
The average specialty drug cost $2,117.07.
Here’s some of their top drugs based on spend:
A few facts…
7 in 10 Americans die from chronic illness.
As many as half of all patients don’t adhere to their prescription regimens.
More that $100B is spent each year on avoidable hospital admissions due to non-adherence.
Adherence to high blood pressure treatment alone could prevent 89,000 premature deaths in the US annually.
They shared that 70.5% of their 683,000 members using a statin in the second half of 2009 had an MPR (medication possession ratio) of 80% or higher (which is considered clinically adherent). They talked about using copay waivers, value-based benefit design, and member education to drive up MPR. [I’d love to see how the 3 compared in terms of results and ROI.]
They talked about an MD intervention program around respiratory illness that got 10% of members to return to therapy. [I’m a big believer that PBMs need to integrate their MD and consumer intervention strategies since 1+1 can equal 3 in some cases.]
They then go thru different therapy class (drug categories) to discuss each one. In the gastrointestinal disorders (think Prevacid, Protonix, Prilosec), I was surprised they didn’t talk about a strategy to drive OTC (over-the-counter) use. [Although with some of the new rulings about what can be considered part of your flexible spending accounts, it may change how people compare the costs of OTCs to copays.]
I’m still a big fan of step therapy in this category using OTCs then H2s then generic PPIs then brand PPIs, but I know step therapy with OTCs can be a pain.
Specialty drugs accounted for 21% of the $300B in 2009 drug spend (National)…by 2030, it’s estimated that specialty will account for almost 50% of drug expenditures.
They talk about Ampyra (a new MS drug) but don’t talk about how they are managing that. [From my NCPDP meeting last week, RegenceRx was talking about more aggressively managing this.]
They share the research from PhRMA that there are 861 drugs in the pipeline for oncology.
Here’s a nice graphic on designing the right benefit…
They provide some best practices around plan design which did prompt some questions for me:
They talk about value-based benefits when MPR is less than 80% for diabetes, high blood pressure, and high cholesterol. I’m good with this as long as it’s not selectively offered to just those with low MPR (i.e., rewarding those who aren’t taking their medications).
They talk about requiring prior auth (PA) before a non-preferred drug is dispensed. Does this mean the formulary is essentially closed?
They talk about using co-insurance to deter the use of brand-name and non-formulary drugs. I’ve always been a skeptic here since the patient doesn’t know the cost of the medication so I believe that flat copays are much easier to understand the difference, but there might be research that I’ve missed on this one.
They talk about reaching out to MDs on generic utilization. This should work but is tough. I had an academic detailing team at Express Scripts and a generic sampling team. I’d love to know what the success rate was and if MDs impressions of generics have changed over the past 5 years.
For tiers, they share data that suggests that the copay savings needs to be $25.50 per month for a patient to choose a generic over a brand (and I might assume one brand over another). As they point out, that’s much larger than the $13 difference which exists today.
I came out to the Mobile Health Summit (Twitter hashtag #mhs10) in DC today, and I had the opportunity to interview Todd Park who is the Chief Technology Officer (CTO) for the US Department of Health & Human Services (HHS). Todd is a great resource for the country and perhaps a surprising bureaucrat (in the nicest sense of the word) given his background as a consultant and then co-founder of athenahealth.
It was an interesting discussion starting around what his role is. The CTO role is a new role in the US government which he describes as an internal change agent who is responsible for working with HHS leadership. He described his objective as forming virtual start-ups to advance new solutions. [A radical departure for those of us that view government as a monolithic organization which is slow to change and full of red tape.]
He said that one of the first questions people ask when they see the new initiatives such as HealthCare.gov is who were the consultants he brought in from Silicon Valley to do the work. He says that it was all internal people. We talked about that being a cultural change which he described as “creating the right vision” and a “work pathway”. That sounds exactly like what one might see a change agent being responsible for – better leveraging internal assets by changing the framework for service delivery.
We talked about several of the initiatives that HHS has worked on lately:
HealthCare.gov which is a focused on helping consumers find public and private options for healthcare. He said this was a 90-day implementation. I think if you go to the site you’ll see a few things:
Easy navigation
Content for multiple personas
Links to social media
Videos, widgets, blog postings, iPhone app, etc.
This is much like what you would expect from a direct-to-consumer company or your health plan.
The Open Health Data Initiative which is focused on taking data which HHS has and making it available for use by companies for FREE. The idea is to stimulate an eco-system around the data and enable better health thru better decisions. He uses the NOAA framework as an example for how they share data to sites like weather.com. He then mentioned that they had done a brainstorming session earlier this year to think about what could be done with this data (some of which was new to everyone). You can learn more and see the 2-hour YouTube video here, but a talk by Todd Park at another event is below.
The Blue Button Initiative which was launched in October and focuses on getting Medicare members and veterans to get a copy of their own data to print, download, share, upload, etc. Already more than 100,000 have downloaded their data. This should certainly be an enabler for PHR adoption.
We then went on to talk about HHS as a “reservoir of innovation mojo” which needs to collaborate with the public sector. In Todd’s words, he sees government as needing to be a catalyst and enabler. When he joined, his idea was not to fly in like aliens and change HHS, but to come in and find ways to unlock the mojo which already existed.
I asked him if he sees this as being a model for the private sector. Obviously, one of the challenges we have everywhere is figuring out the right way to balance co-opetition and competition. If we’re going to “solve” our obesity epidemic, we need to have some collective knowledge and insights rather than constantly re-creating learnings in a microcosm. On the flipside, companies want to create intellectual property and sustainable differentiation. It’s not easy to balance.
But, Todd mentions that several companies are already following in the “blue button” model such as Gallup / Healthways which is making their Well Being Survey data available publicly (for FREE) for the top 200 cities.
Of course, there is a lot of work to do here. I asked him about what the government was doing to address some things at a national level (e.g., obesity) where in my mind we almost need a reframing such as that which happened with littering, smoking, or wearing our seat belts. He brought up three things that were happening:
One of the other things that we talked about was the challenge of making changes to health outcomes with the health literacy levels in the US. I suggested that we need to address this systemically as I believe we need to address financial literacy…beginning in the schools and the home. He talked about needing to making learning fun through educational games. He mentioned that the First Lady had been promoting the creation of apps to accomplish this as part of a competition. (This made me think of the iTots article in today’s USA Today.)
We closed with a quick discussion on other things that he’s monitoring that will drive healthcare innovation. He talked a lot about improvements in the provider payment system – think Accountable Care Organizations (ACOs) and Patient Centered Medical Homes (PCMH). The goal with these is the change from “pay for volume to pay for value”.
Talking to Todd gives you a positive view on what government can do. I can see him motivating his team and his prior teams to follow his vision and embrace change. I’d have to agree with Matthew Holt’s article on Todd Park from earlier this year.
I was quoted in yesterday’s Drug Benefit News with one of my favorite people – Dr. Steve Miller from Express Scripts. This was a follow-up to talk about their predictive model for adherence. Steve confirmed what had previously been reported that it is 85% accurate in predicting the 10% of people least likely to be adherent. He says that the model takes into account past behavior, demographics, condition, and the drug. Those sound like a lot of the right variables.
The article teases us with information that CVS Caremark is planning to publish a study in the upcoming months on their model. Medco Health Solutions comes across as more of a skeptic in the article talking about efforts from 20 years ago that were difficult and expensive to execute.
My quotes were very consistent with what I’ve shared on the blog – fascinating, somewhat skeptical, more concerned about the group that is somewhat adherent than those that are the bottom 10%, implementation of behavior change is more important that the model.
“Everybody’s trying similar efforts in terms of how to predict adherence…but there hasn’t been a model that has proven itself as being a good predictor. Maybe Express Scripts has cracked the code…I would assume that if you can accurately predict who is going to be adherent that will be a good tool.”
However, attempting to change behavior in the top 10% of patients likely to be nonadherent will be tough, Van Antwerp contends. “The industry is still waiting for that proof,” he maintains. “If we can predict that patients are adherent but can’t change behavior, then the model doesn’t do us much good.”
I was fielding a few questions today about the predictive model from Express Scripts. The concept of predictive modeling is one that everyone is working on and holds great allure. BUT, it is only a piece of the puzzle. In the dialogue, I identified three key tenets for success.
Predictive Model – Can you predict who is likely to act in certain ways – be adherent, log-in to the member portal, use mail order, switch to generics, pick up the phone?
Segmentation Model – Once you can predict people, can you develop a segmentation model about how to get them to take action based on different attributes – gender, age, past behavior, preferences, income, other?
Intervention Strategy – If you can predict who is most likely to act and know what type of segment they fall into, do you have a cost-effective intervention strategy to get them to take action…right message at the right time using the right channel? For adherence, this could be reminders, coaching, devices, or other tools. (As many people say, a less sophisticated strategy executed perfectly is better than a complex strategy executed less than perfectly.)
And, then you need to study and refine these on an ongoing basis especially since topics like adherence may be affected by macro-economic trends (e.g., economy), patient beliefs (e.g., fatalism), and other attributes (e.g., plan design) on top of the attributes in your models.
I do believe we’re early in the days of modeling and that the access to data and greater availability of informatics resources will increase the development and focus on these models.
I came across this framework that I like. It seems to take into account the health literacy and emotional challenges of a patient when receiving and assimilating bad news.
COMFORT stands for:
Communication
Orientation
Mindfulness
Family
Ongoing
Reiterative
Team
Communications – use clear and familiar language.
Orientation – set reasonable expectations.
Mindfulness – focus on the patient without being distracted.
Family – include the family in the information and the ongoing support.
Ongoing – stress the ongoing activities so there is no sense of abandonment.
Reiterative – continue to reinforce the message to help them come to terms.
Team – coordinate care so that there is not conflicting or confusing information.
“We have more than 60,000 drug stores in America, 38,000 grocery stores, and about 13,000 McDonalds. How difficult is it for someone to find a McDonalds hamburger if they want one?…Not hard. So why do we need 64,000 drug stores within our network?”
— Michael Jacobs, national clinical practice leader at Buck Consultants, told AIS’s DRUG BENEFIT NEWS.
I can’t believe I missed this one earlier this year especially since a friend of mine is one of the authors…BUT this is an important one for the industry showing that not only did adherence improve moving from retail to mail order pharmacy but as pharmacy costs when up the corresponding medical costs went down MORE!
Objective: To compare long-term diabetes medication adherence and healthcare costs in patients using mail order pharmacy versus retail pharmacy.
Methods: The MarketScan database was used to identify patients who filled prescriptions for oral anti-diabetes medications in a retail pharmacy for at least 6 months before switching to mail order pharmacy for at least 12 months. These patients were matched to others who used retail pharmacy continuously for at least 18 months. A propensity score was used to create matched groups of patients comparable on probability of switching to mail order, weighted Poisson regression was used to analyze differences in medication adherence, and Tobit regression was used to compare costs.
Results: A total of 14,600 patients who switched to mail order were matched to 43,800 patients who used retail pharmacy continuously. The average adjusted adherence in retail pharmacy was 63.4% compared to 84.8% after switching to mail order. Per-member-per-month total healthcare and total medical costs were on average $34.32 and $37.54 lower in the mail order group, respectively. Diabetes-related medical costs were on average $19.14 lower in the mail order group, while pharmacy costs were $14.13 higher.
Limitations: Limitations include a patient population under the age of 65, no information on pharmacy benefit design, and limited follow-up time relative to that necessary to identify long-term diabetes complications.
Conclusions: After adjusting for measured confounders of medication adherence and disease severity, individuals who switched to mail order pharmacy had higher medication possession ratios and trended toward lower total and diabetes-related medical costs over time.
I’ve talked about this with many clients. Since physicians don’t always engage patients in the basic dialogue around adherence, how can they decide to increase doses or change prescriptions simply if the patient’s condition isn’t becoming better? This has to drive waste in the system.
The reality is that a physician may get a lab value that shows that their patient’s cholesterol (or A1c or…) is higher than it was last time. They know the patient is on a certain dose of the medication. They instinctively think to increase the dose or change the medication. BUT…they don’t always ask the patient about their adherence to the medication. This is attributed to multiple reasons:
They don’t see adherence as their issue.
They assume the patient is adherent.
They assume the patient would tell them if they weren’t adherent.
They assume if they ask that the patient would lie to them and say they were adherent.
I’d heard about a study done about a decade ago that had looked at this, but it had never been published. I was excited to see that Medco had published some research on this topic today.
There were some interesting things in the research also. It was another validation on the fact that men are more adherent than women. And, it showed that people with multiple conditions were more adherent. I would expect that there is a curve around this that people with a few medications and those with lots of medications are least likely to be adherent, and those somewhere in the middle are most adherent. (But, I’ve never looked at the data with this question in mind.)
Do you brush your teeth more before you go to the dentist?
Are you more likely to take your medications the week before you go back for your physician visit?
YES!
But, do we make that clear to the physician? No. When the physician asks if you’re taking your medications, the answer is yes. That’s not a lie. What they need to know is how many pills are left since you last filled your medication? How many pills did you start with? How many did you lose?…
You get the picture. I like the term here that our Chief Medical Officer used – “white coat adherence”.
Now, let’s imagine that the physician orders a blood test for your cholesterol and your LDL hasn’t dropped, there are three scenarios:
1. They go back and really push you on your adherence (or diet and exercise);
2. They believe you but they assume the medication dose isn’t strong enough and increase your dose; or
3. They believe you but they assume the medication isn’t working and change your medication.
These are minimally issues for the healthcare system – wasted costs – but there is also the potential for giving you an unnecessarily high dose or changing you to a riskier medication since the default one didn’t work.
How do we address this? It’s not easy. This involves a few things:
1. Improving physician access to data (i.e., adherence data);
2. Improving physician – patient communications; and
3. Helping patients stay adherent and understand the impact of their medication (and lifestyle decisions) on their health.
I continue to see more and more data on the physician patient gap in communications. This is from a few years ago, but a study showed that 40 to 60% of patients could not correctly report medication expectations 10 to 80 minutes after physicians provided information, AND more than 60% of patients misunderstood prescription directions immediately after doctor visits. (source)
Per my prior two posts on this, Drug Benefit News (DBN) published an article today on this topic. Renee talked with me along with several other people to get a perspective on the topic.
Here are a few quotes from the article:
“Auto-refill for prescriptions is all the focus lately,” says George Van Antwerp, General Manager of Pharmacy at Silverlink Communications. “Everyone from the big PBMs to the local pharmacies are encouraging this.” This is because auto-refill programs address one of the common patient-reported issues with adherence — forgetfulness — allowing insurers to “minimize gaps in care.” Auto-renewals, on the other hand, are not considered common practice and many payers are hesitant to implement the service.
Express Scripts, Inc. is one of the few PBMs developing an auto-renewal program, which it will offer through home delivery. “Renewals are much more problematic than refills for patients when procrastination occurs,” Bob Nease, Ph.D., chief scientist at Express Scripts, tells DBN. “If you procrastinate on getting a renewal, it’s not just a matter of calling the pharmacy. You have to get a new prescription with a physician. And if you talk to physicians, they pull their hair out over this issue.”
Others contend that auto-refill and renewal programs may up plan costs by increasing medication waste. The concern is that auto-renewals may result in “provisions of medications that may not be a current active medication therapy or where the patient may have experienced an adverse effect and their drug therapy may have been modified by their physician,” contends Andy Szczotka, senior vice president of corporate clinical services at HealthTrans. “This may lead to potential medication waste and increased member and plan sponsor costs.”
“This is all done under the assumption that you’re improving adherence,” [Jerry] Shipkin [from SXC] says. “But I have not seen solid evidence that this improves adherence.”As an alternative, SXC sends its members auto-reminders with phone calls or e-mails to inform patients about their upcoming refill. “This is a more patient-friendly program,” Shipkin argues. “When you measure patient adherence on this program, it’s just not significantly lower than what you might get on an auto-refill program when you calculate the reversal.”
Van Antwerp contends that auto-reminders aren’t enough. “Everyone does auto-reminder programs,” he says. “In my mind, that’s the minimum that a pharmacy or PBM should do.”In addition, he argues, “anything can lead to accumulation if the patient is not using their medication and refilling their drug on a regular basis.” However, “how many patients do that?” he asks. “Drugs cost money.” While it could drive up more prescriptions, “no one’s going to pay for — and/or pick up — scripts they don’t need,” he maintains.
CVS Caremark Corp. claims its “Ready-Fill” program is “a convenience our members love,” according to Bari Harlam, the PBM’s senior vice president of marketing. The program includes auto-refills and auto-renewals. “There are a lot of people that have trouble being adherent, and this is a service that we offer to our consumers that helps do the work for them,” she tells DBN.
CVS Caremark members enrolled in the program receive notifications about their refill a few days before it’s shipped, and have the option of cancelling the refill. The PBM also calls its members’ physicians to request additional refills. “The physicians’ offices view this as part of the normal workflow, and retail and mail pharmacies are always reaching out to them for particular medications,” Harlam says.
The study came out yesterday. I pulled the data from the executive summary into a powerpoint for all you visual people like me. Some interesting statistics on the value of pharmacy satisfaction and retention. Maybe this will create the business case for more tracking and focus on impacting satisfaction in pharmacy. I think we’ve seen that over the past few years for managed care with individual insurance.
Before you peek, who (pharmacy type) do you think gets the highest average ranking in satisfaction?
I can’t seem to find a lot of infographics on pharmacy (which is surprising to me since I find the space so fascinating). Here’s one I found in a Fast Company article.
NOTE: The opinions expressed here are those of the author and are not reviewed in advance by anyone but the individual author. They represent personal opinions not the opinions of any employer.

 December 21, 2010